
 Environmental
 Wetland Restoration & Monitoring
Baseline ecological survey and a multi-year monitoring framework to restore degraded wetland habitat around active industrial sites.
A selection of engagements across environmental, geospatial, energy and engineering domains. Representative examples; get in touch for sector-specific references.
Environmental Baseline ecological survey and a multi-year monitoring framework to restore degraded wetland habitat around active industrial sites.
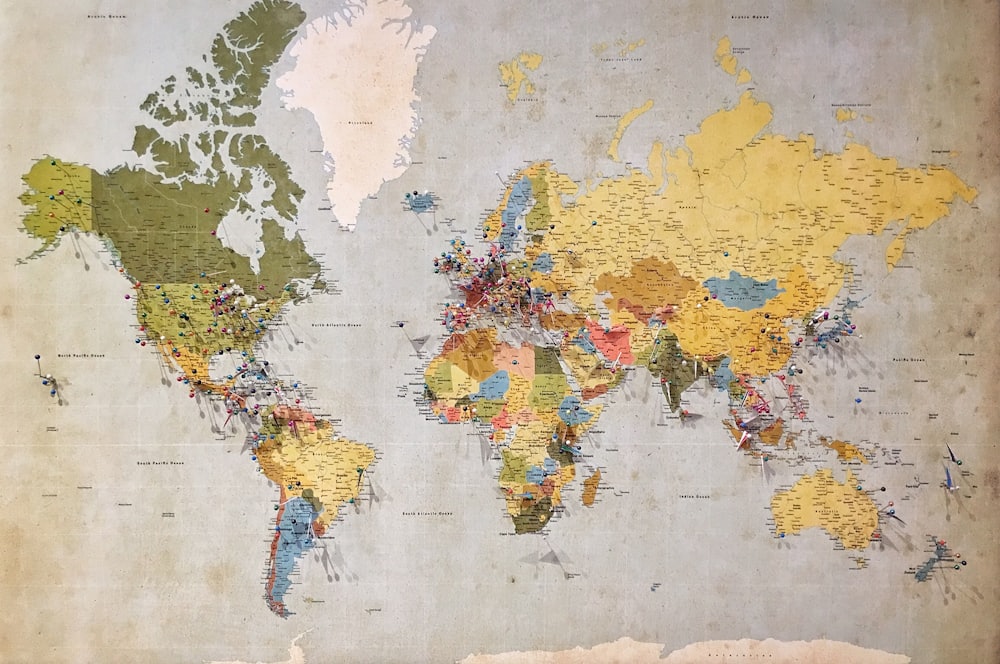 Geospatial
 Remote-sensing and GIS pipeline turning satellite imagery into a decision-support dashboard for sustainable regional planning.
 Renewable Energy
 Technical and financial feasibility for a hybrid solar deployment, including efficiency modelling and a phased transition plan.
 ESG Advisory
 End-to-end ESG strategy, materiality assessment and reporting aligned to international standards for a manufacturing client.
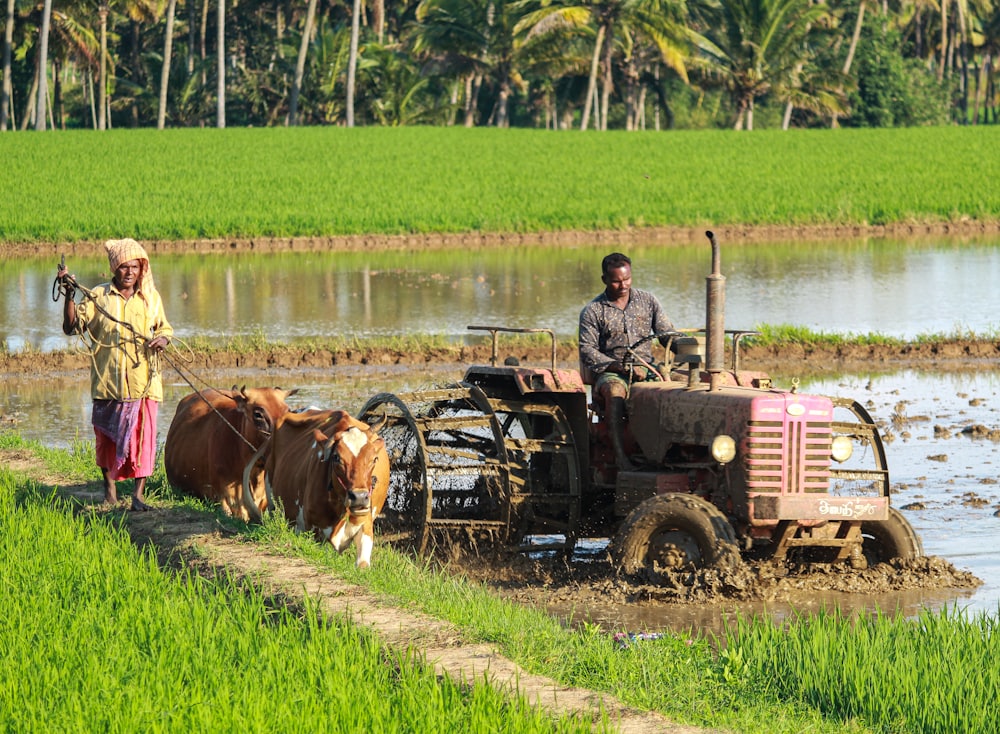 Agri-Tech
 Soil and water resource mapping with precision-agriculture recommendations to lift yields while protecting the watershed.
 Engineering
 Engineering feasibility, environmental due diligence and design review for a public infrastructure development.
Maps and spatial analyses from our environmental and geospatial work, from national pollution surfaces and satellite flood mapping to site-level sampling designs. Select any plate to open it full size.
A national atlas of atmospheric pollutants (methane, nitrogen dioxide and fine particulate matter) resolved below state level and paired across years so change is visible at a glance.
Baseline national methane surface. Concentrations climb out of the humid south (the Niger Delta and the south-west hold the lowest readings) into a broad elevated band across the middle belt and north-east, peaking through Nassarawa, Benue, Taraba, Gombe and Borno.
The same surface five years on. Every class break shifts upward: the national ceiling rises from 1,959 to 2,007 ppb and the mid-range band moves roughly 30 ppb higher, with the elevated zone thickening across Niger, Kogi, Nassarawa and Kaduna.
Tropospheric nitrogen dioxide traces combustion directly, so this reads as a map of economic activity: sharp maxima over the Lagos–Ogun conurbation, Abuja, Kano and the Port Harcourt oil corridor, set against a near-clean Sahel background.
By 2025 the hotspots hold position but the moderate band spreads: the 16–21 ppb class now covers most of the middle belt and south-east rather than isolated corridors, and the national maximum climbs to 67 ppb.
Fine particulate matter follows the harmattan dust regime rather than the cities: a pronounced maximum across Katsina, Kano, Jigawa, Bauchi and northern Kaduna, falling steadily southward to the cleanest air along the coast and in the south-east.
Two years later the northern maximum is both higher and wider: the top class rises from 10.09 to 11.78 µg/m³ and covers a contiguous block from Katsina through Kano and Jigawa into Bauchi, while the low-concentration southern zone pushes further north.
A multi-temporal radar assessment of five flood events traced to releases from the Jebba and Kainji hydroelectric dams on the River Niger. Flood extents were detected by backscatter change in Google Earth Engine, then overlaid on cropland, population and LGA boundaries to measure what each release put under water.
Five dam-release events compared side by side: total flooded area, flooded cropland, estimated population exposure, the temporal trend and land-cover composition. Inundation grew from 7 km² in October 2018 to a peak of 255 km² in September 2022, while flooded cropland rose with every event to 122 km² in April 2025, 63.5% of that event's footprint.
WorldPop 2020 population overlaid on each flood mask. The September 2022 release exposed an estimated 24,822 people, the largest of the study period, and the dry-season release of February 2025 still reached 15,623. A second panel sets out the population of each flood-affected LGA.
Flooded km² by Local Government Area for every event. Pategi (129.3 km²) and Edu (120.4 km²) held 98% of the September 2022 inundation; then the flood centroid shifted, with Kaiama taking 166.6 km² in April 2025, 87% of that event.
Two matrices summarise exposure by LGA: how many of the five events reached each one, and the largest area it lost in a single event. Pategi and Edu flooded in every event, the chronic flood core along the Niger floodplain, while Ilorin East and Ilorin West register for the first time in 2025.
Each affected LGA ranked by its maximum single-event flood area and its event frequency, then graded from Very High to Low, with a separate watch class for urban Ilorin. Pategi, Edu and Kaiama sit in the Very High tier, followed by Moro and Baruten.
Location maps for an environmental sampling campaign around oil and gas facilities in Delta State. Each plate places the sampling points (ambient air and rainwater at set distances from the flare, groundwater, storm water, produced water and creek water from up-stream to down-stream) inside Delta State and Nigeria locator frames.
Six sampling points on the creek system near Kwale: paired air-quality and rainwater stations 30 m and 75 m from the flare, a groundwater well, up-stream and mid-stream surface water, and a storm water point to the north-west.
The Jones Creek campaign: up-stream and down-stream water stations grouped with an air-quality and rainwater point 60 m from the flare, plus two stations on the water to the south-east at the Gracious 1 and Gracious 2 houseboats.
A dense station layout around the Egwa and Amaranta flow stations: an air-quality and rainwater transect at 60 m, 200 m and 500 m from the flare, produced water, storm water, a groundwater well, and up-stream, mid-stream and down-stream creek samples.
The nine-point flow station design in an alternate layout: air-quality and rainwater stations at 60 m, 200 m and 500 m from the flare alongside produced water, storm water, groundwater and creek samples, set against a green national locator.
We'll share relevant experience and outline how we'd approach your work.
Contact us